Construction Waste Hits Its Recycling Target. Most of It Becomes Road Base.
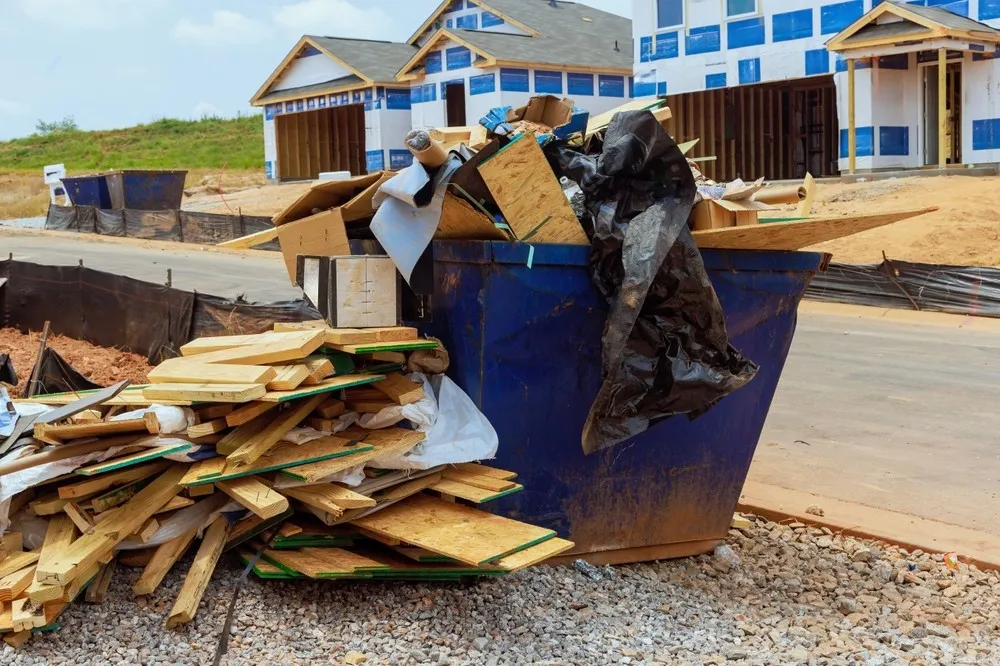
Construction is the largest waste stream in Europe by a wide margin. It is also the one with the healthiest-looking numbers: against a target of 70%, the EU average recovery rate for construction and demolition waste was 89% in 2020, in the European Commission’s Joint Research Centre assessment.
Member states cleared that target years ago. It is a rare case of a circular economy goal that was set, pursued and met.
The question this piece is about is what it counts.
The scale of the material
Eurostat put total EU waste generation at 2,233 million tonnes in 2022, and construction contributed 38.4% of it — around 860 million tonnes, which is our arithmetic rather than a figure Eurostat publishes directly. No other sector comes close. Households, for comparison, generate a small fraction of this.
Most of it is inert mineral material: concrete, brick, tile, aggregate, stone. That composition is what makes the material both easy to “recover” and hard to recycle in any sense that closes a loop.
What the target actually counts
The 70% figure comes from the Waste Framework Directive (2008/98/EC), Article 11(2)(b). The wording is the point:
preparing for re-use, recycling and other material recovery, including backfilling operations using waste to substitute other materials
Backfilling is inside the target. A tonne of crushed concrete used to fill a quarry void, level a site or form a road sub-base counts toward the same number as a tonne genuinely returned to productive use. The target also excludes naturally occurring soil and stone, which keeps the cleanest-looking material out of the denominator.
Eurostat’s own indicator definition is explicit about this: it measures material recovery “including through backfilling operations”.
Strip backfilling out and the picture changes
This is not a semantic complaint, and there is a number that shows it.
On 2018 data, Malta reported 100% recovery including backfilling, and 24% excluding it. Not a rounding difference — the same country, the same waste, two numbers that describe entirely different systems.
Malta is the extreme case, but it is not alone. On the same data, Poland, Czechia, France, Estonia, Romania, Croatia, Ireland and Portugal all failed to exceed the 70% target once backfilling was excluded. Eight member states that pass on the published figure and fail on the underlying one.
How much of the EU total is backfilling is harder to pin down. One 2016 study found that around 89% of the recycled volume reported for 2013 was recovered in backfilling operations. That is a single study on data now more than a decade old, and we would not lean on it — but no more recent EU-wide figure appears to be published, which is itself the problem.
The comparison does not survive contact with the data
Even the numbers that exist are not comparable across countries.
A 2023 review found that misinterpretations of the term “backfilling” impede cross-country comparison of published EU recovery rates. Romania, to take one documented case, reports figures that exclude backfilling even though it is among the most-used treatment operations there — so its rate understates on a measure where other countries overstate.
A 2025 review in Sustainability puts it more bluntly, arguing the EU’s reported 89% recovery rate is a statistical artefact rather than a circularity achievement. That is a strong claim from a single paper, and we flag it as one. But the direction of travel across the literature is consistent.
Where the material actually goes
The European Environment Agency is unusually direct about this. Its assessment is that high recovery of construction and demolition waste is based, to a large extent, on backfilling or on low-grade recovery — using recycled aggregates from the mineral fraction in applications such as road sub-bases.
That is the regulator’s own description of its own headline number.
The reason is where the value sits. In concrete, the cost and the embodied carbon are concentrated in the cement, and crushing concrete does not recover cement. It recovers the stone, which was already the cheap part. The binder is spent.
This is the aluminium problem in reverse. With aluminium, the metal keeps almost all its value through recycling and the obstacle is sorting. With concrete, sorting is comparatively easy and the value simply is not recoverable by crushing.
The number nobody publishes
We went looking for one specific figure: what share of recycled aggregate goes into new structural concrete rather than sub-base and fill.
We could not find it for Europe. The qualitative finding is consistent across the literature — recycled aggregate is technically usable in structural concrete and is mainly used for sub-bases instead — and national snapshots exist, such as the estimate that only 15–20% of Spanish construction and demolition waste is treated and revalued as a construction material. But a pan-European split does not appear to be published anywhere.
That absence matters more than most of the figures above. It is the number that would say whether the loop is closing, and it is the one nobody reports. Readers of our piece on chemical recycling will recognise the shape of this.
Why it is harder than it looks
Four obstacles, none of which a recovery target addresses:
- Demolition is faster than deconstruction. Separating materials for reuse costs more than knocking a structure down and crushing the result, and nothing in the target rewards the difference.
- Reclaimed structural elements have no easy route to certification. A steel beam or concrete panel with unknown load history cannot simply be re-specified, and the liability sits with whoever signs it off.
- Contamination is decisive. Gypsum, asbestos in older stock, treated timber and composite insulation all limit what can be done with the mineral fraction.
- The material is heavy and low-value. Transport economics mean it is handled close to where it arises, which caps the scale any processing route can reach.
What would settle it
One number, published consistently: material recycling of construction and demolition waste excluding backfilling, by member state, on a shared definition of backfilling. The 2018 revision of the directive defined backfilling and required it to be reported separately, so the raw material should exist. What does not exist is a comparable published series.
A second would help: the share of recycled aggregate entering new structural concrete. That is the figure that distinguishes a closing loop from an efficiently managed one-way flow.
What to watch
- Whether a comparable backfilling-excluded series appears in Eurostat reporting. Until it does, the published recovery rate describes compliance rather than circularity.
- The Construction Products Regulation revision, bringing environmental declarations and eventually digital product passports to construction materials. The same question applies as to the DPP generally: what is actually in force, and who verifies the declaration.
- Cement decarbonisation, which matters more here than recycling rates. If the binder holds the carbon, the binder is where the answer is.
The uncomfortable part
This is the clearest case we have found of a policy that works exactly as written and does not do the thing it appears to do. Nobody is cheating. The rate is real, the material is diverted from landfill, and backfilling is a legitimate use that displaces virgin aggregate.
But a sector reporting 89% recovery while sending much of its material into the ground as fill is not circular, and the headline number does not say so. Malta’s 100% and its 24% are both true. Only one of them describes a circular economy.
Set this beside textile collection and India’s e-waste rules, and the pattern repeats: the measurable half got legislated, and the measurement is what improved.
Sources: Eurostat
waste statistics
for generation and the construction share (2022 reference year); Directive
2008/98/EC Article 11(2)(b) for the 70% target and the backfilling wording;
Eurostat indicator cei_wm040 for the recovery-rate definition; the European
Commission’s Joint Research Centre for the 89% EU average and the national
range; the European Environment Agency’s
assessment of construction and demolition waste
for the characterisation of recovery as largely backfilling and low-grade; and
published analyses of 2018 data for the backfilling-excluded rates. The 2013
backfilling share and the Spanish figure come from single studies and are
labelled as such in the text.